Showing posts with label Cardiology. Show all posts

Tuesday, August 22, 2017

A 55 Year Old Man Presents To Emergency With Chest Pain For 6 Hours...

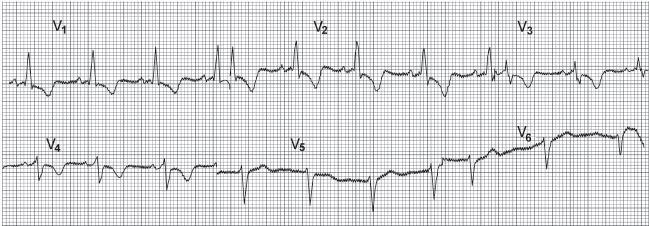
The ECG shown below was recorded in the A & E department from a 55-year-old man who had had chest pain at rest for 6 hours. There were no abnormal physical findings.
What does the trace show, and how would you manage him?


The ECG shows:
• Sinus rhythm
• Normal axis
• Normal QRS complexes
• ST segment depression - horizontal in leads V3-V4, downward-sloping in leads I, VL, V5-V6

Monday, July 17, 2017

Atrial Fibrillation - ECG and Learning Questions/Answers


ECG Criteria
• P wave: Absent (P may be replaced by fibrillary f wave).
• Rhythm: Irregularly irregular (R-R interval is irregular). (Atrial rate is very high and ventricular rate is less).

According to the rate, atrial fibrillation may be of 2 types:
• Fast atrial fibrillation: Heart rate >100 beats/min.
• Slow atrial fibrillation: Heart rate <100 beats/min.

Q. What is atrial fibrillation?
Ans. It is an arrhythmia where atria beat rapidly, chaotically and ineffectively, while the ventricles respond at irregular intervals, producing the characteristic irregularly irregular pulse. Any conditions causing raised atrial pressure, increased atrial muscle mass, atrial fibrosis, inflammation and infiltration of the atrium can cause atrial fibrillation.

Q. What are the types of atrial fibrillation?
Ans. There are 3 types of atrial fibrillation:
• Paroxysmal: Discrete self-limiting episodes. May be persistent if underlying disease progresses.
• Persistent: Prolonged episode that can be terminated by electrical or chemical cardioversion.
• Permanent: Sinus rhythm cannot be restored.

Tuesday, July 11, 2017

A 26-year-old woman, who has complained of palpitations in the past, presents to the emergency department ....

A 26-year-old woman, who has complained of palpitations in the past, is admitted via the A & E department with palpitations. Her ECG is shown below:


What does the ECG show and what should you do?

The ECG shows:
• Narrow-complex tachycardia, rate about 200/min
• No P waves visible
• Normal axis
• Regular QRS complexes
• Normal QRS complexes, ST segments and T waves

Clinical interpretation
This is a supraventricular tachycardia, and since no P waves are visible this is a junctional, or
atrioventricular nodal, tachycardia.

Diagnosis: Junctional (atrioventricular nodal re-entry) tachycardia.

What to do
Junctional tachycardia is the commonest form of paroxysmal tachycardia in young people, and

Ashman Phenomenon - ECG


ECG Findings
• Aberrant ventricular conduction, usually with RBBB pattern.
• Altered durations of the refractory period of the bundle branch or ventricular tissue are present, commonly due to atrial fibrillation, atrial ectopy, and atrial tachycardia

Points to Remember:

1. After depolarization, tissue repolarizes during its refractory period. Refractory period changes with the preceding cardiac cycle, with longer R-R intervals producing longer refractory periods and shorter R-R intervals producing shorter refractory periods.

2. A longer R-R interval lengthens the following refractory period. When an early or premature (ectopic) depolarization reaches the ventricular conduction system before it has completely repolarized, aberrant conduction may occur and be manifest on the ECG with a bundle branch block (BBB) pattern.

3. Ashman phenomenon most commonly appears with an RBBB pattern, since the right bundle has a longer refractory period than the left bundle.

4. Ashman phenomenon is often seen in atrial fibrillation, when a long R-R interval is followed by a much shorter R-R interval.

Monday, July 3, 2017

ECG and Brief Discussion - Right Atrial Hypertrophy


ECG Criteria
• P - Tall, > 2.5 mm (> 2.5 small squares), better seen in LII, LIII, aVF and sometimes in V1 .
(Tall P is called P pulmonale).
• P in V1 - Biphasic, tall initial positive deflection (> 1.5 mm) with a small negative deflection (only positive deflection may be present).

Q. What does P pulmonale indicate?
Ans. It indicates right atrial hypertrophy or enlargement.
(It is called P pulmonale, because it is commonly seen in severe pulmonary disease).

Q. What are the causes of P pulmonale?
Ans. As follows:

Friday, June 30, 2017

A 60 year old woman with a h/o Rheumatic heart disease and recently being treated for heart failure...


This ECG was recorded from a 60-year-old woman with rheumatic heart disease. She had been in heart failure, but this had been treated and she was no longer breathless.

What does the ECG show and what question might you ask her?

The ECG shows:
• Atrial fibrillation with a ventricular rate of 60-65/min
• Normal axis
• Normal QRS complexes
• Prominent U wave in lead V2
• Downward-sloping ST segments, best seen in leads V5-V6

Clinical interpretation
The downward-sloping ST segments (the 'reverse tick') indicate that digoxin has been given. The
ventricular rate seems well-controlled. The prominent U waves in lead V2 could indicate hypokalaemia.

Left Posterior Fascicular Block - ECG


ECG Findings
• QRS complex widening to 90 to 120 ms.
• Right axis deviation must be beyond 100 degrees and must have no other cause (such as lateral myocardial infarction).
• Small R wave and large S wave in the high lateral leads, I and aVL.
• Slurred S wave in V5 and V6.
• This example also contains unrelated ST changes.

 Clinical Pearls
1. The signal exiting the AV node is carried rapidly to the upper aspect of the LV and all of the RV through the intact left anterior fascicle and right bundle, where depolarization is rapid. However, conduction to the inferior portion of the left ventricle is slower and must proceed cell-to-cell
due to the blocked left posterior fascicle. Therefore, the latter portion of the QRS depolarizes toward the inferior myocardium, manifesting as strong right axis deviation.

Monday, June 26, 2017

Right Ventricular Hypertrophy with Strain - ECG

ECG Criteria
Tall R wave in V1 > 7 mm (also deep S in V5 or V6).

Other Criteria
• R/S ratio in V1 > 1 (R is > S in V1).
• R in V1 + S in V5 or V6 is equal to or > 10.5 mm.
• R in aVR > 5 mm.
• S in V1 < 2 mm.
• Incomplete RBBB (rSR in V1).
• QRS-wide.
• Small q in V1.
• Right axis deviation (between + 90° and + 180°).


Causes Of  Right Ventricular Hypertrophy:
• Chronic cor pulmonale.
• Mitral stenosis with pulmonary hypertension.
• Pulmonary hypertension (due to any cause).
• Pulmonary stenosis.
• Eisenmenger’s syndrome.
• Fallot’s tetralogy.
• ASD.
• VSD.
• Tricuspid regurgitation.

Saturday, June 24, 2017

A 50-year-old man is seen in the Emergency department with severe central chest pain...

A 50-year-old man is seen in the Emergency department with severe central chest pain which he says is present for about 18 hours.
His ECG is shown below:

Question:
What does this ECG show and how would you manage this patient?

Answer:

Left Anterior Fascicular Block - ECG

Left anterior fascicular block (LAFB), also known as left anterior hemiblock is an abnormal condition of the left ventricle of the heart, related to, but distinguished from, left bundle branch block (LBBB). It is caused by only the anterior half of the left bundle branch being defective. It is manifested on the ECG by left axis deviation.


ECG Findings
• QRS complex widening, usually 90 to 120 ms
• Left axis deviation beyond minus 45 degrees with no other cause (such as inferior myocardial infarction)
• Small R wave and large S wave in the inferior leads
• Slurred S wave in V5 and V6

Points To Remember:
1. The signal exiting the AV node is carried rapidly to the inferior aspect of the LV and all of the RV through the intact left posterior fascicle and right bundle, where quick depolarization occurs. However, conduction to the high lateral and upper portions of the left ventricle is slower and must proceed cell-to-cell due to the blocked left anterior fascicle. Therefore, the latter portion of the QRS
depolarizes toward the upper lateral myocardium, manifested as strong left axis deviation.

Monday, June 19, 2017

Left Ventricular Hypertrophy (LVH) - ECG Study

ECG criteria of LVH (voltage criteria):
• S wave in V1 + R wave  in V6 or V5 is > 35 mm (S V1 + R V6 > 35 mm).
(This criteria is applicable only above 25 years of age).

Other criteria of LVH:
• R in V5 (or V6) > 26 mm.
• R in aVL > 11 mm (or 13 mm).
• R in aVF > 20 mm (also in LII and LIII).
• R in LI + S in LIII > 25 mm.
• R in LI > 15 mm.
• R in V6 is equal to or greater than R in V5 (normally R in V5 is taller than R in V6).
• S in V1 or V2 > 25 mm.
• Sum of all QRS in all 12 leads > 175 mm.
• Left axis deviation (QRS between –30° and –90°).

                                         Left ventricular hypertrophy with strain

It is important to note that: In young and thin person, this voltage criteria is not diagnostic (in younger person, S in V1 + R in V5 or V6 should be greater than 40 mm).

Q. How to confirm the diagnosis of LVH?
Ans. By echocardiography (M-mode).

Q. What are the causes of LVH?
Ans. As follows:

Thursday, June 15, 2017

Case Study - Complete 3rd Degree Heart Block

An 80-year-old woman, who had previously had a few attacks of dizziness, fell and broke her hip. She is  found to have a slow pulse, and her ECG is shown below. The surgeons want to operate as soon as possible but the anesthetist is unhappy.


What does the ECG show and what should be done?

The ECG shows:
• Complete heart block
• Ventricular rate 45/min

Clinical interpretation
In complete heart block there is no relationship between the P waves (here with a rate of 70/min)
and the QRS complexes.
The ventricular 'escape' rhythm has wide QRS complexes and abnormal T waves.

What to do

Left Bundle Branch Block - ECG


ECG Findings
• Wide QRS complex, at least 120 ms (three small blocks).
• T wave appears on the opposite side of the baseline from the QRS complex.
• The QRS precordial axis is normal or deviated to the left.
• QRS complex deflection is predominately downward in lead V1 and upward in lead V6.

Points to Remember
1. The signal exiting the AV node does not proceed through the left ventricular conduction system. It must propagate more slowly cell-to-cell through the myocardium, starting in the septum. Therefore, the QRS is wider and the bulk of the depolarization signal is deflected toward the far lateral aspect of the heart.

Tuesday, June 13, 2017

Understanding Cardiac Axis In ECG


Cardiac Axis Definition: It is the sum of all the depolarization waves as they spread through the ventricles as seen from the front.

Axis Determination
• Axis can be derived most easily from the amplitude of QRS complex in LI, LII and LIII.
• The greatest amplitude of R wave in LI or LII or LIII indicates the proximity of cardiac axis to that lead.
• The axis lies at 90° to the isoelectric complex, i.e. positive and negative deflections are equal in any of the lead LI, LII, LIII, aVL, aVR and aVF.

Normal axis is between –30° to +90°.

Quick and Simple Way of Determination of Cardiac Axis
• Positive QRS in both LI and LII means axis is normal.
• Positive QRS in LI and negative in LIII (tall R in LI and deep S in LIII)—means left axis deviation.
• Negative QRS in LI and positive in LIII ((tall R in LIII and deep S in LI)—means right axis deviation.

Left Axis Deviation
When the cardiac axis is between –30° to –90°.
Causes are :

Sunday, June 11, 2017

A 60 year Old Man Presenting With Vague Chest Pain On Exertion..

A 60-year-old man was seen as an out-patient, complaining of rather vague central chest pain on exertion.  He had never had pain at rest.
ECG was done and is shown in picture below:


What does this ECG show and what would you do next?

The ECG shows:
• Sinus rhythm
• Normal axis
• Small Q waves in leads II, III, VF
• Biphasic T waves in leads II, V6; inverted T waves in leads III, VF
• Markedly peaked T waves in leads V1-V2

Right Bundle Branch Block - ECG

ECG Findings
• Wide QRS complex, at least 120 ms (three small blocks).
• QRS complex has sR’ or rsR’ in leads V1 and V2.
• Slurred S wave leads V6 and I.


Important Points:

1. The signal exiting the AV node is carried rapidly to the LV through the intact left bundle, but is delayed into the right ventricle, where depolarization must propagate cell-to cell. Since the RV myocardial mass is much smaller than that of the LV, this delay in depolarization is best seen in the leads overlying the right ventricle, leads V1 and V2.

2. Acute right heart strain, as may occur with pulmonary embolism, may result in new onset right bundle branch block (RBBB).

Tuesday, June 6, 2017

Understanding A Normal ECG - Details about The Waves And Intervals.

Characteristics of a Normal ECG:
• Normal ECG recording consists of P wave (atrial beat), followed by QRS, ST and T wave (ventricular beat).
• Capital letter P, Q, R, S, T—indicates large wave (> 5 mm).
• Small letter p, q, r, s, t—indicates small wave (< 5 mm).


TYPES OF WAVES IN ECG
• P — Deflection produced by atrial depolarization.
• QRS — Deflection produced by ventricular depolarization.
• Q (q) — First negative deflection produced by ventricular depolarization. It precedes R wave.
• R(r) — First positive deflection produced by ventricular depolarization.
• S(s) — Negative deflection after R wave produced by ventricular depolarization.
• T — Indicates ventricular repolarization.

OTHER WAVES
• J — At the beginning of ST segment.
• U — Not always seen. When present, it follows T wave, preceding the next P wave. It indicates repolarization of interventricular septum or slow repolarization of the ventricles.

INTERVALS IN ECG
• PR interval — Distance between the beginning of P to beginning of QRS (Q), ideally called PQ interval.
• PP interval — Distance between two successive P waves. In sinus rhythm, P-P interval is regular.
• RR interval — Distance between two successive R waves. In sinus rhythm, R-R interval is regular.
• QT interval — Distance interval between the beginning of Q wave and the end of T wave.


SEGMENT IN ECG
ST—Distance from the end of QRS complex to the beginning of T wave. It indicates the beginning of ventricular repolarization. Normally, it is in isoelectric line, but may vary from – 0.5 to + 2 mm in chest leads.

Monday, June 5, 2017

A 25 Year old Pregnant woman presents with Palpitations...

This ECG was recorded from a 25-year-old pregnant woman who complained of an irregular heart beat. Auscultation revealed a soft systolic murmur but her heart was otherwise normal.


What does the ECG show and what would you do?

The ECG shows:
• Sinus rhythm
• Ventricular extrasystoles
• Normal axis
• Normal QRS complexes and T waves